Does your company use continuously updated analytics to make decisions?
If you’re like many companies I’ve helped, the answer is probably not very well. With different documents and half-baked KPI (Key Performance Indicator) tracking spreadsheets tucked away here and there, most businesses:
1. don’t have a clear picture of what they are tracking nor why
2. fail to understand what the data is telling them about the health of their business.
Enter the Business Intelligence Dashboard, which many companies are integrating to successfully move the needle on people, productivity, profitability, and growth.
What is a Business Intelligence (BI) Dashboard?
Data is great, but only if you can interpret or visualize what it is telling you. A Business Intelligence Dashboard (BI) allows executives to visualize what the data is indicating. The dashboard can then be used to answer key business questions and identify strengths and weaknesses in the health of your business.
As Deloitte explains, “Data, in its original form, is just raw information with the potential to become knowledge. The real value lies in using these databases to create descriptive and even predictive models usable for business purposes. Doing so will allow authorized employees from all layers of your organization to easily extract the essential insights from enormous amounts of information (Big Data) and effectively apply them as part of their daily business routine.”
The right visuals allow easy comparison over time and reveals surprising relationships between key business elements, which normally go unnoticed.
Do Business Intelligence Dashboards Save Time and Money?
All signs and data point to “YES!” Businesses of all sizes and specialties can benefit from using a BI dashboard. Whether the goal is to expedite a certain process, like in the case below with physicians who need STAT access to patient scans to make life-altering decisions for patient care, or to monitor ever-changing data input by colleges following student success, it’s hard to find a business that couldn’t benefit.
Case Study #1: Improved Processes Boost Productivity and Enhance Patient Care
In the case of HealthPartners, BI dashboards significantly reduced the time required to retrieve patient comparison studies. To make this happen, the team tested and provided feedback on workflows, “creating opportunities to address potential problems before rollout. When the solution did go live, the command center experienced the lowest recorded volumes of user calls in the team’s history and closed within three days. No longer reacting to downtime and other problems caused by multiple disparate, geographically dispersed systems, the team can work more proactively.”
Case Study #2: College Uses BI software to Enable Inexperienced Staff to Take the Lead
As Alison Nimura, Manager of the Business Intelligence Team at Portland State University explains, BI dashboards “Empower[ed] staff with enhanced analytics tools ultimately help[ing] us deliver an even more enriching and structured learning environment for our students.”
The goal for Portland State was to use the BI dashboard to improve the processes in place which helped to monitor enrollment, advising, budgeting, and “almost every aspect of university life.” The success of the school’s operations depends on access to key data in order to function. Having access to accurate and intuitive data—that staff of all levels were able to interpret and visualize—changed the game.
What are the Benefits of a Business Intelligence Dashboard?
The benefits of the Business Intelligence Dashboard (BI) are plentiful, which only underscores why they are growing so rapidly in popularity.
Benefit #1: Make Better Decisions Based on Data, not Emotions
While much success can be attributed to data collection, most organizations still struggle to build data into their business strategy and align the data with the need of the business. Why? Many people find basic statistics confusing. And we are often very proud of our decision-making abilities and don’t need data in the way to prove us otherwise. But making decisions based on emotion will always yield inferior results.
After all, if you could objectively identify your business’s strengths and weaknesses and answer all the questions on how to improve productivity, you likely wouldn’t be reading this article right now. We must put the ego aside and allow the data to drive performance.
Benefit #2: Help Staff Adopt Change Sooner
Buy-in isn’t easy. Shifting is uncomfortable. People loathe change. They wonder how the changes could affect their role, and by proxy their careers and their futures. So, it’s only natural to get pushback when new changes are implemented—even if their goal is to make everyone’s life easier in the long-run.
One of the easiest and most effective ways to improve buy-in for change is to show them the “how” behind the “why.” The visualization that BI allows us to do can help staff understand the changes that are taking place—as well as the benefits of those changes—in an objective and non-threatening way.
Benefit #3: Business Scale of Stronger, Quicker
When it comes to business, time is money and none of us have time to waste. Businesses who integrate Business Intelligence (BI) software into their self-assessment not only scale quicker, but they scale stronger. This is because they are letting data lead the way. Data isn’t emotional. It doesn’t care. Data is there to tell you what you need to hear in order to grow with the greatest speed and the greatest strength.
Designing Your Business Intelligence Dashboard
As a business owner, you probably have an idea of the things you’d like to track in your business. You also have ideas about questions you’d like answered. But which data reveals which answers? And are you even looking at the right thing at the right time from the right perspective?
Knowing what to track can be one of the biggest impediments to getting started. That’s why visualizing analytics and questions you want (and desperately need) answered is the easiest way to start.
Bonus Alert! Sticky notes or visual board software is inexpensive, fun, and a great collaboration technique.
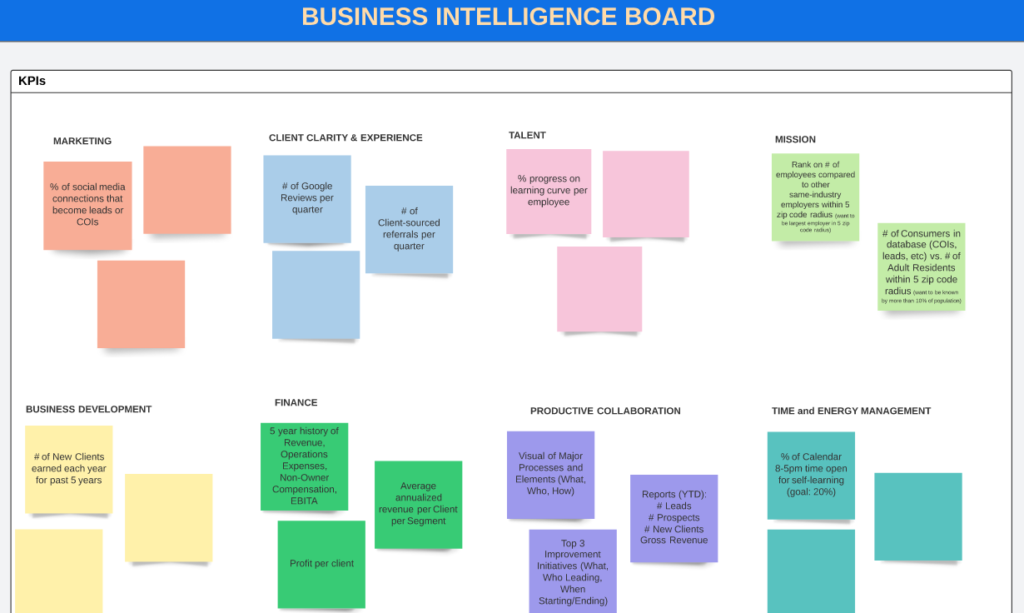
Keep the following tips in mind when designing your BI dashboard:
- Each department will need to be represented on the dashboard or have their own unique dashboard (Ex: Management, marketing, accounting, etc.).
- Select the right KPIs for the audience viewing the dashboard. Executives will require a very different set of KPIs than managers or specialists.
- Stick to the most important data. Displaying irrelevant or unnecessary KPIs can confuse your audience, and result in poor adoption of the dashboard itself.
- Make sure your KPIs are attainable, measurable, and specific. Vague or irrelevant KPIs won’t uncover the information that will propel you forward.
- Include KPIs you care about.
Each metric tracked on your board should be one that has a specific purpose. The metrics you’re gathering should drive you to action through the visualization and analysis of meaningful results.
Let Data Steer the Ship
You don’t have to be at odds with your business decisions anymore when you allow data visualization to guide the way. All you need is a few peers, the passion for a better business, and a few questions, that once answered, will help you visualize your way to a better existence.